Putting museum power on the map
The ‘soft power’ of cultural institutions like museums can now be mapped and properly appreciated globally after researchers developed a unique online tool.
In 2014, Brisbane became the third Australian city after Melbourne and Sydney to break into the top 25 of the Monocle Soft Power city survey – thanks largely to the influence of just one institution, its Gallery of Modern Art.
Galleries and museums are key players in the promotion of global soft power – which is “the ability to influence the behaviour of others through persuasion and attraction.”
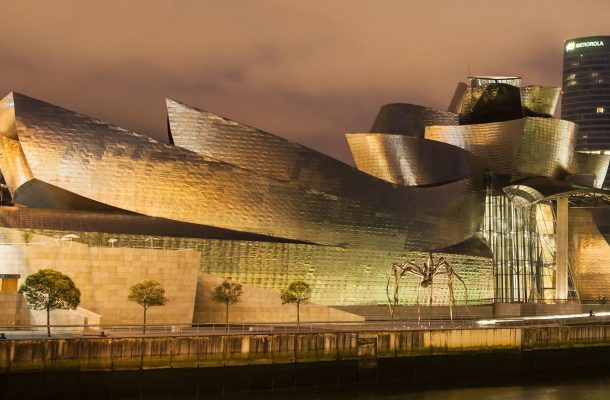
Just think of how Spain’s Frank Gehry-designed Guggenheim Museum has boosted Bilboa, or how the MONA museum has raised the profile of Tasmania’s Hobart.
With over 100 million objects held across Australia’s Gallery, Library and Museum (GLAM) sector, including unique collections of Asia-Pacific origin, Australia’s cultural institutions have massive potential to serve as magnets for international tourists, leading world curators, artists and scientists, as well as being sites for capital investment.
But to appreciate the latent soft power of Australia’s cultural institutions we need to know more than just what is in these institutions, we need to know who and where they are reaching and where the opportunities lie for increasing that reach.
In other words, we need to map their soft power. So, we did.
Deep Mapping is a collaborative practice-based creative research project that has produced the first ever digital mapping system to not only measures museum soft power, but also visualises it on the global map.
We used spatially-oriented software to map and visualise the geographical reach of an institution’s soft power and highlighted areas of potential reach.
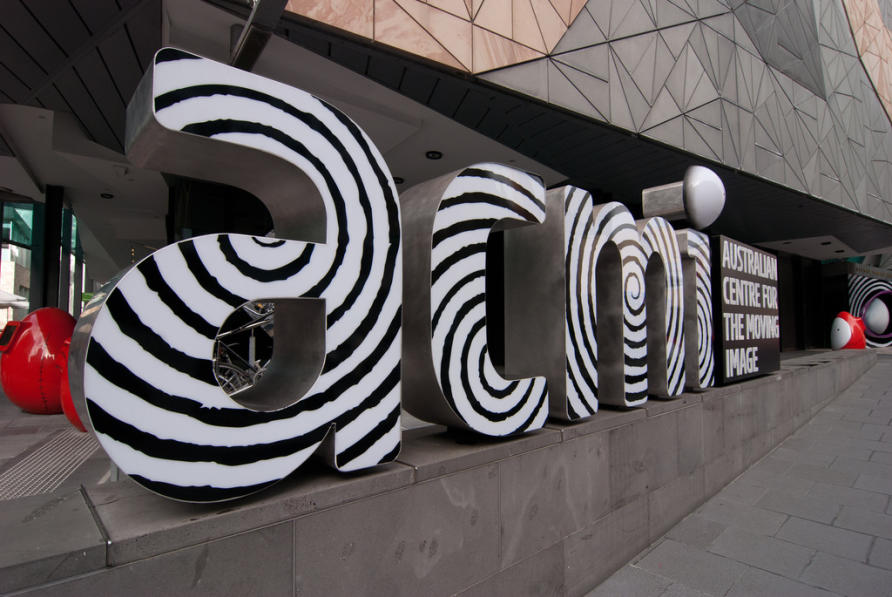
In collaboration with the Australian Centre of the Moving Image (ACMI), we have applied the technology to create a pilot web application, the ACMI Soft Power Map – a single-museum focused online tool to geo-visualise and assess the ACMI’s “attraction power” in Melbourne and around the world.
The museum soft power mapping system analyses demographic statistics of specific locations in order to evaluate the soft power appeal of ACMI to people living in the area – viewing each area as a politically, culturally and economically defined locale. The digital mapping system not only shows us the areas on the global map where ACMI’s audience comes from, but more importantly, reveals who those people are.
For example, it maps how ACMI’s Melbourne-resident visitors are distributed across over 200 postcode areas in the city. It also provides key data on each neighbourhood in terms of its social demographic profile, cultural, religious and linguistic diversity, family, household, professional affiliation and income information.
This mapped data reveals geographic zones of maximum audience engagement, as well as potential missed opportunities for outreach and impact.
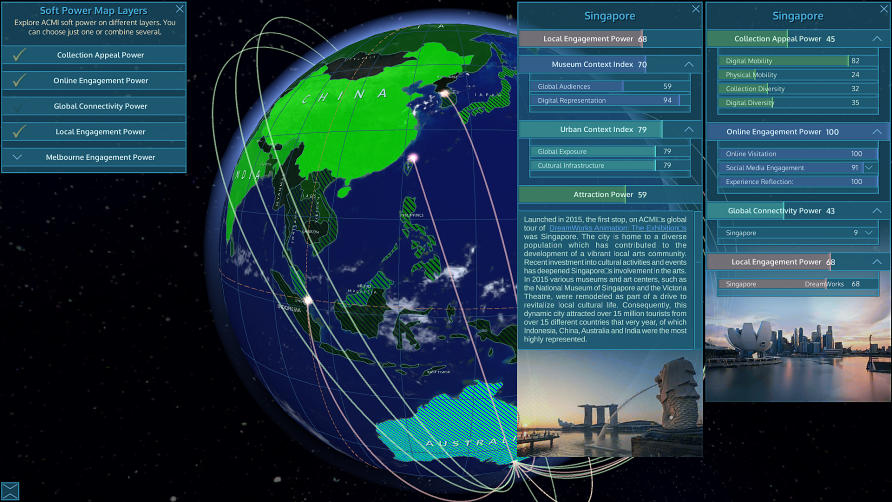
The ACMI Soft Power Map digital platform splits its geographic analysis into different layers of data.
For example, the Collection Appeal Power Layer maps the cultural and linguistic diversity of ACMI’s collection, which boasts around 200,000 moving-image works, 70 per cent of which were produced outside Australia, covering 49 different languages – making the content accessible to people living in over 200 countries.
The map then correlates the characteristics of these collections with multiple variables covering the social demographic profile, physical or digital mobility of the population of each country; this means users can evaluate their potential global appeal and develop more focused strategies for reaching and engaging different audiences.
The Global Connectivity Power Layer compares the diversity, geographic spread, durability and strength of ACMI’s institutional connections with around 180 organisations in 80 cities.
This information reveals the global organisational ecosystem ACMI is operating in, highlighting its strong ties with Europe and North America, and its emerging relationships with cultural institutions in the Asia-Pacific region.
By mapping soft power, we gain new insights into how the global museum sector works that aren’t otherwise obvious. For example, once the global connections between institutions are mapped it becomes clear that museums amplify their soft power when they work together and establish meaningful connections, rather than acting as rivals.
The mapping exercise also reveals that soft power isn’t a universal force that equally impacts audiences wherever they are. Instead audience reactions are shaped by local social-demographic, cultural and economic factors.
The next stage of the project is to advance the mapping system to measure soft power of museum clusters that build cultural infrastructure within cities, in collaboration with key museums across several countries.
Museums around the world are increasingly seeking to better understand their own soft power including how to assess it and understand how it varies across different cultural communities and geographic locations.
With this digital mapping system, the sector now has a tool to help guide it.
This article was published by Pursuit. Dr Grincheva will host a round table webinar on Demystifying Museum Soft Power: Geo-visualising Museums’ Influence on the 11th of December. You can register for it here.
Dr Natalia Grincheva is an academic at the University of Melbourne. Her research interests include culture and communication, cultural diplomacy, digital communication and technologies and museum studies.