Understanding housing affordability
Finding solutions to improve housing affordability requires an understanding of the nature of the problem. Executive Director Demography and Economics with the NSW Department of Planning & Environment Justin Douglas has some key facts to inform discussions about policy options.
A. Housing affordability varies widely across NSW
House prices vary significantly across NSW. The map below shows typical or average prices for a variety of locations. The highest prices tend to be in Sydney. In some parts of NSW, homes can be purchased for significantly less than $100,000.
Map 1: Median house prices, selected locations

B. The housing affordability challenge has changed over time
The 1980s and 1990s saw the discussion about housing affordability focused on people’s ability to meet mortgage repayments, especially after the mortgage interest rates rose from 13.5 in June 1988 to 17 per cent in June 1989. Higher interest rates affected both existing home owners (except pre- April 1986 loans, which were capped at 13.5 per cent) and first home buyers.
In Sydney, rising house prices (up more than 80 per cent between March 1987 and March 1989), were an additional challenge facing first home buyers.
Chart 1: Mortgage repayment to income ratio (new mortgages)
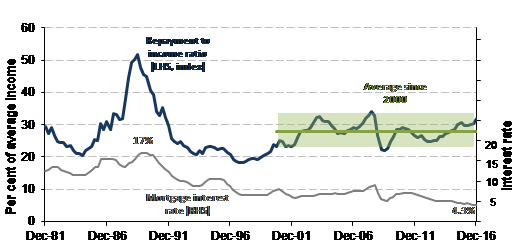
Notes: Income based on two full-time employees, both earning the average wage without penalty rates or bonuses. Mortgage repayments based on median detached house over 30 years, 20% deposit. Source: DPE calculations
Since 2000, rising house prices have largely been offset by lower interest rates. As a result, mortgage serviceability has remained in a narrow band, averaging 28 per cent of the income of a two-income household. Over the last 30 years, increased purchasing power due to lower interest rates and higher average wages explains more than 90% of the increase in Sydney house prices.
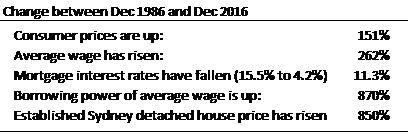
Table 1: 30 year comparisons
C. Saving a deposit has become more difficult
Lower interest rates have made larger mortgages more affordable, but haven’t helped first home buyers to save a deposit. Traditionally, a 20 per cent deposit has been required to avoid paying lender’s mortgage insurance. In addition, home buyers need to save for stamp duty, moving costs and other up-front expenses.
The time needed to save such a deposit has lengthened as average prices have risen. For example, a 20% deposit plus stamp duty on an average detached home in Sydney equaled 52 weeks of the average full-time pre-tax wage in 1986. Today, the equivalent amount is equal to 158 weeks of pre-tax average full-time wages.
Financial institutions have responded to the increased difficulty faced by first home buyers in saving a deposit by developing a wider range of low deposit products. Although this has allowed some first home buyers to enter the market sooner, it has also meant that they have taken on proportionately larger loans.
Chart 2: Time to save a 20% deposit (months of average pre-tax average wage)

D. The challenge is land affordability
The main driver of Sydney’s rising house prices is land values, not the structures that are built on the land. As a result, a typical house and land package has swapped from around 2/3 house and 1/3 land to the opposite mix.
Chart 3: Changing composition of a typical house and land package
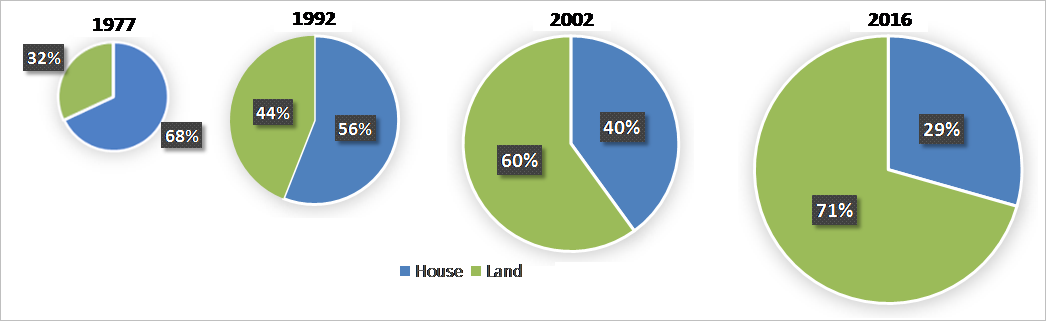
Sources: Applied Economics, Domain, realestate.com.au, DPE calculations
In practice, many home buyers have responded by purchasing smaller blocks, located further from the city centre. At the same time, average house sizes have increased although the shift towards more people living in apartments may have partly offset this. Chart 4 contains data that has been adjusted for these changes in composition, quality and location, as well as general inflation.
Chart 4: Sydney house prices v construction costs (adjusted for inflation)
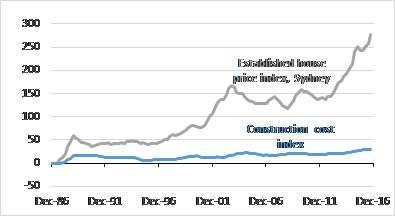
Source: ABS House price index, dwelling investment deflator and CPI, DPE calculations
Map 2 shows how residential land values vary across Sydney. Chart 5 shows how unimproved land values have increased over the last 30 years for different Sydney suburbs. On average, Sydney residential land is worth around 10 times its 1986 value.
Map 2: Indicative unimproved residential land values per square meter (2014)
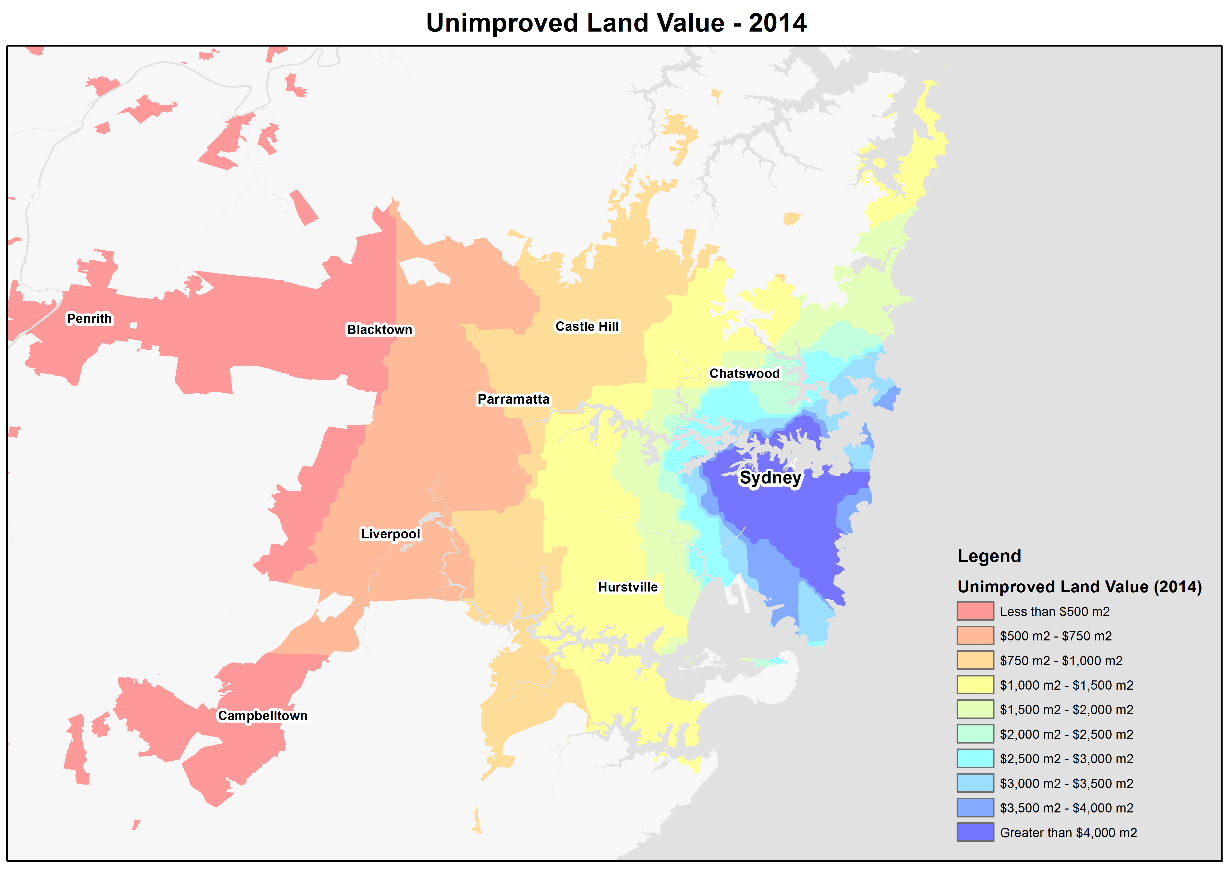
Source: NSW Valuer-General’s Metropolitan Land Values report and DPE calculations
Chart 5: 2014 unimproved land values as a multiple of 1986 values
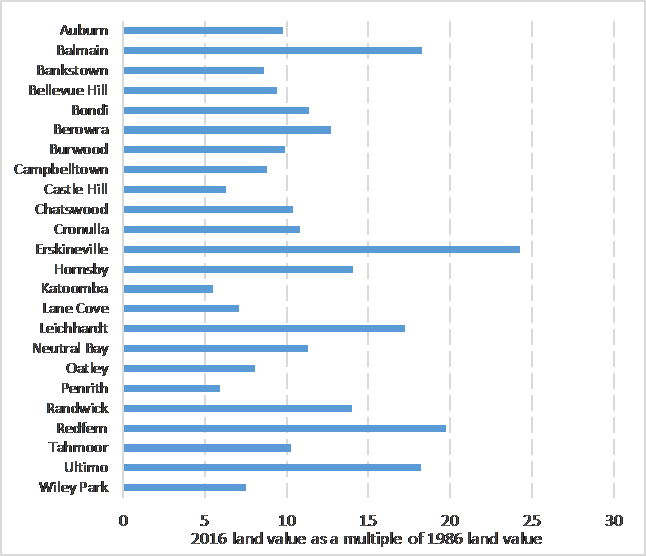
Source: NSW Valuer-General’s Land Tables, DPE calculations
Note: 2014 is the latest Representative land values published.
Housing Affordability Online Consultation:
Q: What can be done to improve housing affordability?
Justin is Executive Director, Economics, Population and Land-use Analytics with the NSW Department of Planning & Environment. He is a public policy adviser with more than two decades of experience in Australia’s preeminent economic policy advising agencies, including senior executive roles at the Commonwealth Treasury and in the Prime Minister’s Department. During that time he advised Prime Ministers Howard, Rudd and Gillard, as well as a number of Commonwealth Treasurers, on a broad range of economic, social and public policy challenges, including housing affordability.


markmuir
May 11, 2017 at 12:19 am
Hi Justin.
I’m a little curious about chart 1. Is that interest payments only across the entire time series? Or is it gross payments to banks from debtors? One thing worth noting is that Sydney was a significant outlier in during the late 80s interest rate surge: http://www.rba.gov.au/publications/bulletin/2012/dec/images/graph-1212-2-04.gif . Given Sydney’s population, I imagine this would have had a significant effect on the overall picture for NSW (although, at least over the last 15 years, NSW and VIC have been more ‘exuberant’ compared to other states: https://www.rba.gov.au/speeches/2017/images/sp-gov-2017-05-04-graph5.gif).
Looking at the aggregate, Australia-wide figures paints a very different picture when comparing the late 80s to now (see: http://i.imgur.com/62XRonH.jpg). This chart shows that when variable mortgage interest rates hit ~17% in 1989, around 6% of aggregate household disposable income was being eaten up by mortgage interest payments. When mortgage rates ‘spiked’ in 2007, this time at a lower 9.5%, a larger proportion (11%) of aggregate household disposable income was being eaten by interest repayments. God only knows what the disposable income hit would be if interest rates were to reach a similar level now.
This suggests that growth in dwelling prices has significantly outpaced the growth in household disposable income since the late 80s. This is corroborated when you examine house prices as a percentage of per capita GNI, particularly when you compare Australia to the rest of the world (http://i.imgur.com/fqvfNe9.png). To break that one down a bit further, here’s a chart showing how Australia compares to other rich, industrialised countries in terms of price-to-income and price-to-rent ratios (http://i.imgur.com/e2ZlqwG.png , we appear to be in third place for the PI ratio, although the IMF has us in second: http://resources3.news.com.au/images/2014/06/11/1226951/266727-abd71b48-f160-11e3-aad6-e5c45a718cb3.jpg). By the looks of it, also all of this growth in due to Australians taking on larger amount of debt in proportion to their income: http://www.smh.com.au/cqstatic/12z7v7/1310housing_729.png.
Lastly, while wage growth (and inflation, to an extent) meant that debt principles taken out in the early 80s were manageable, I’m not sure if things will work out the same this time around. We seem to be headed towards a deflationary environment. In addition, growth in annual employee compensation has basically hit 0% (http://i.imgur.com/1mppYQb.jpg), average weekly earning also appear to be going backwards in real terms (http://i.imgur.com/eRmuiwL.jpg), and labour share of factor productivity increases is also declining in real terms (http://i.imgur.com/t0g1k7F.jpg).
All that aside, the construction input cost figures and land price figures are very interesting. Given the recent concerns expressed about housing affordability, there seems to be a very compelling case for examining re-introduction of a tax on the unimproved value of land (particularly given Treasury modelling suggest it will actually improve, rather than reduce, economic efficiency: http://www.treasury.gov.au/PublicationsAndMedia/Newsroom/Speeches/2015/~/media/Treasury/Publications%20and%20Media/Speeches/2015/Tax%20reform/Images/Roger_Brake_5.ashx).
It’s a bit of a shame that NSW (and VIC) intend to sell/long-term lease their land registries to private monopolists; I imagine this would hamper any such policy analysis in the future.